Boxplots are a measure of how well distributed is the data. This graph represents the minimum, maximum, median, first quartile and third quartile in the data set. It is also useful in comparing the distribution of data across data sets by drawing boxplots. R Boxplot is created by using the boxplot() function.
Syntax
The basic syntax to create a boxplot in R is :
Following is the description of the parameters used:
- x is a vector or a formula.
- data is the data frame.
- notch is a logical value. Set as TRUE to draw a notch.
- varwidth is a logical value. Set as true to draw width of the box proportionate to the sample size.
- names are the group labels which will be printed under each boxplot.
- main is used to give a title to the graph.
Creating the Boxplot in R
The below script will create a boxplot graph for the relation between mpg(miles per gallon) and cyl (number of cylinders) from the well known mtcars data set.
boxplot(mpg ~ cyl, data=mtcars,xlab="Number of Cylinders",ylab="Miles Per Gallon",main="Mileage Data")
When we execute the above code, it produces the following result

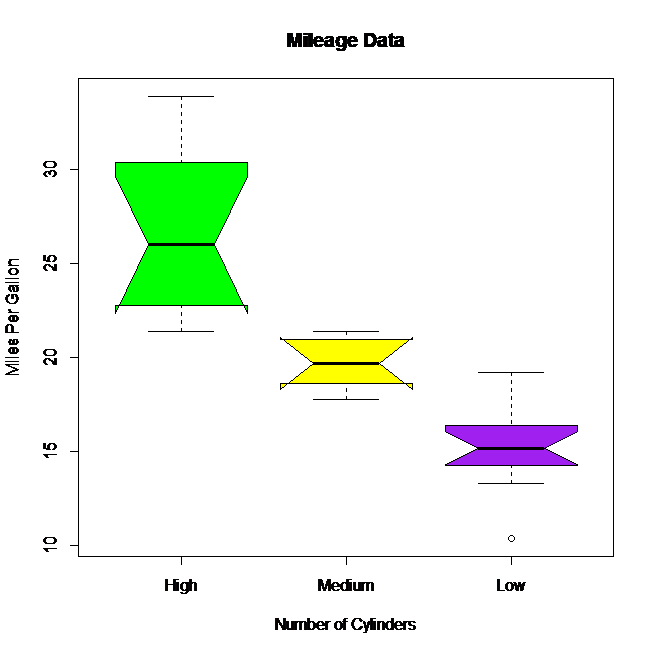
R Boxplot with Notch
We can draw boxplot with notch to find out how the medians of different data groups match with each other. The below script will create a boxplot graph with notch for each of the data group.
boxplot(mpg ~ cyl, data=mtcars,xlab="Number of Cylinders",ylab="Miles Per Gallon",
main="Mileage Data",notch=TRUE,col=c("green","yellow","purple"),names=c("High","Medium","Low"))
output of above script is
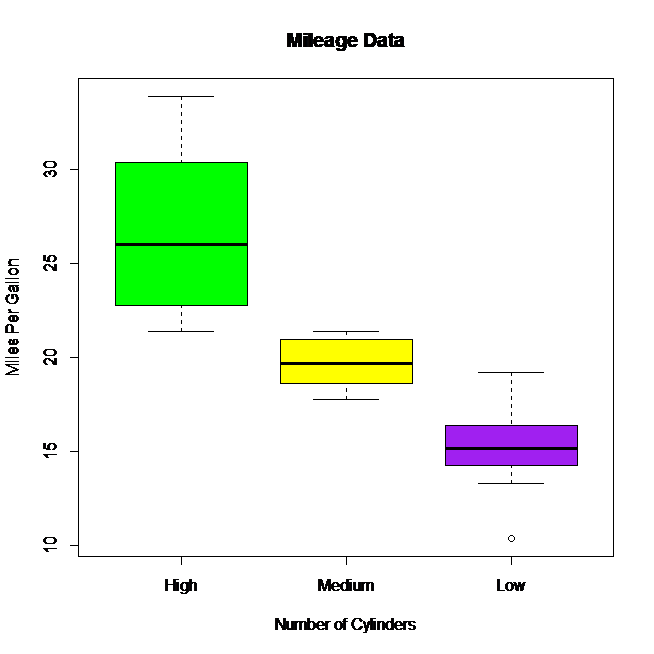
In the above script if we replace value of notch=FALSE Then the output will be
![]()
![]()
")
 and Max() Function in R")


