R pie chart is created using the pie() function which takes positive numbers as a vector input. The additional parameters are used to control appearance of pie charts in R are labels, color, title etc.
Syntax R Pie chart
The basic syntax for creating a pie chart using the R is:
pie(x, labels, radius, main, col, clockwise)
Following is the description of the parameters used:
- x is a vector containing the numeric values used in the pie chart.
- labels is used to give description to the slices.
- radius indicates the radius of the circle of the pie chart.(value between -1 and +1).
- main indicates the title of the chart.
- col indicates the color palette.
- clockwise is a logical value indicating if the slices are drawn clockwise or anti clockwise.
A simple Pie chart in R:
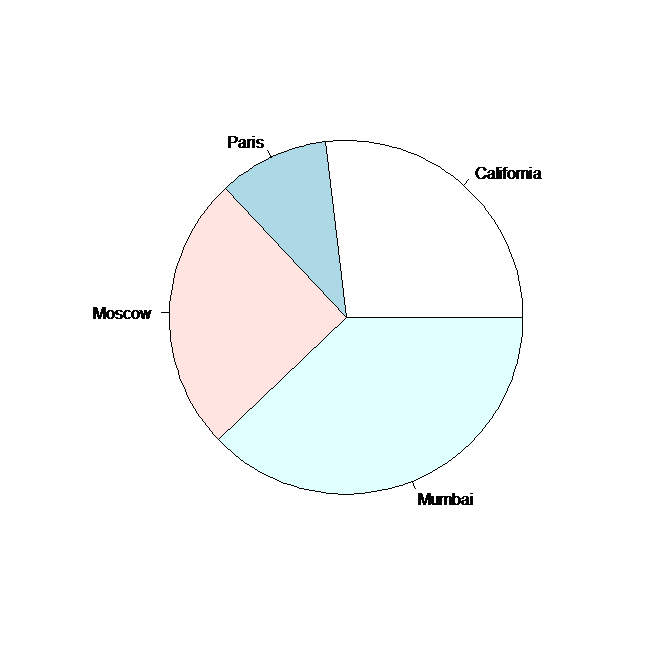
A very simple pie chart is created using just the input vector and labels. The below script will create and save the pie chart
# Create data for the graph.
x <- c(32, 12, 30, 53)
labels <- c("California", "Paris", "Moscow", "Mumbai")

# Plot the chart
pie(x,labels)
When we execute the above code, it produces the following simple pie chart
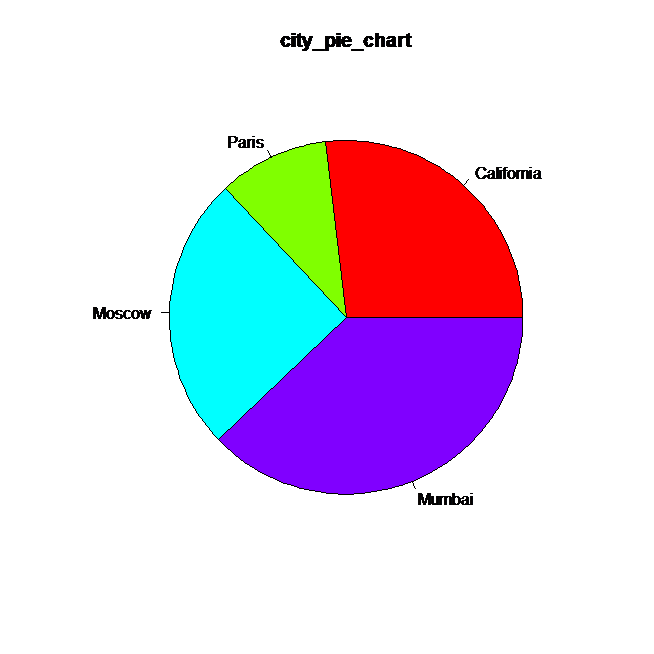
Now lets Add the Title and change the colour of the pie chart. Lets name title as “city_pie_chart” and colour with four rainbow colours as follows
pie(x,labels,main="city_pie_chart",col=rainbow(4))
so the output will be
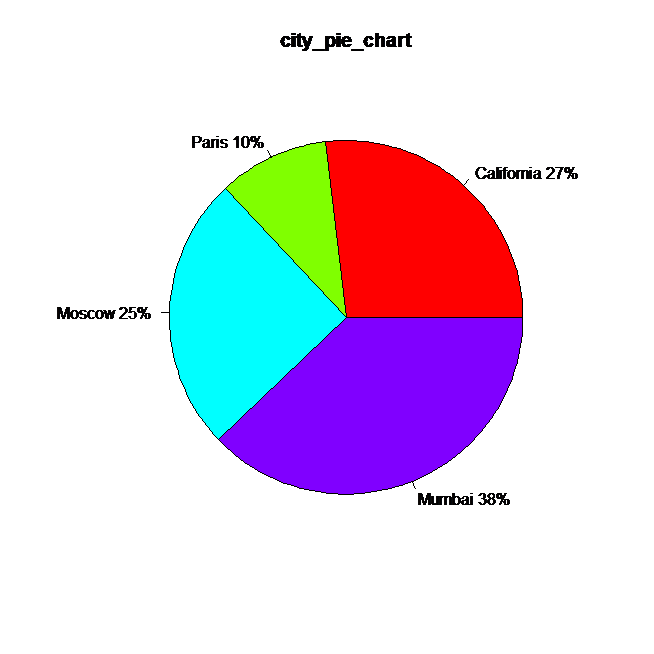
R Pie chart with labels and respective percentage:
Now lets construct a pie chart with labels followed by Percentages. Look at the below example
x <- c(32, 12, 30, 45)
labels <- c("California", "Paris", "Moscow", "Mumbai")
pct <- round(x/sum(x)*100)
lbls <- paste(labels, pct) # add percents to labels
lbls <- paste(lbls,"%",sep="") # ad % to labels
pie(x,labels = lbls, col=rainbow(length(lbls)),main="city_pie_chart")
line no:3 calculates the percentages and stores it in variable pct
line no:4 concatenates labels and pct values and stores it in variable lbls
line no:5 concatenates lbls and % symbol with null separator andstores it in variable lbls
line no:6 lbls is passed as input to the label parameter in pie() function
which produces the following output.
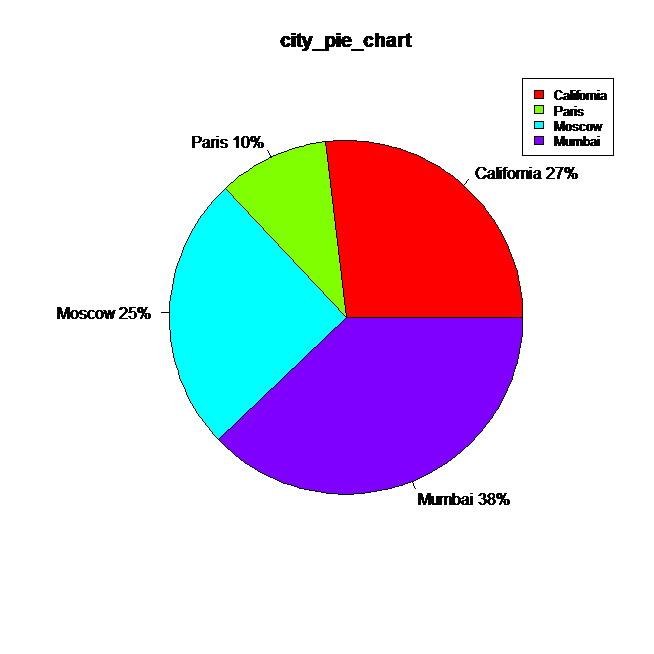
R Pie chart with Legends
now lets add legend to the above pie chart it is quite simple and can be done with the function legend() which has to be run along with the pie() function
pie(x,labels = lbls, col=rainbow(length(lbls)),main="city_pie_chart")
legend("topright", c("California", "Paris", "Moscow", "Mumbai"), cex=0.8,fill=rainbow(length(x)))
which produces the following output
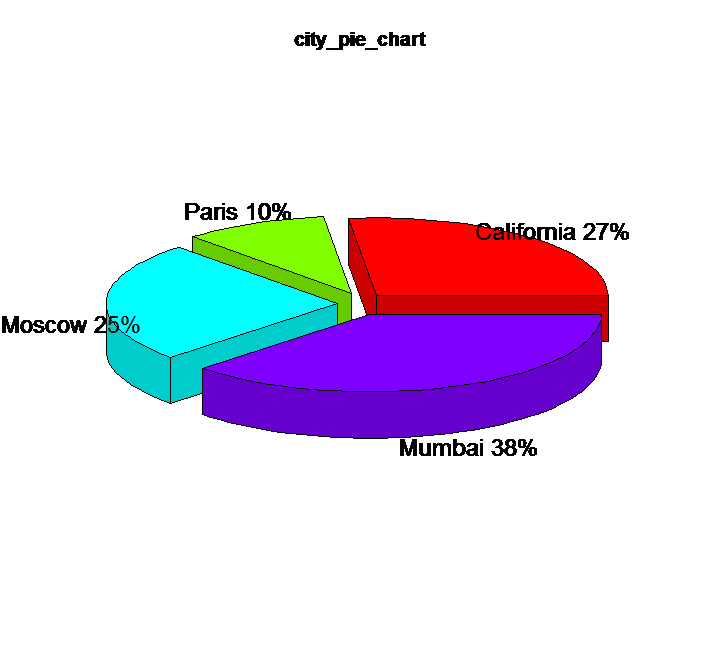
3D Pie Chart in R:
The package plotrix has a function called pie3D() that is used for plotting a 3D Pie chart in R.
library(plotrix)
pie3D(x,labels=lbls,explode=0.1,main="city_pie_chart")
explode is a parameter used to increase or decrease the gap of split in slices. Above code produces the following output
![]()
![]()
, upper() & title() - islower(), isupper() & istitle() function in python")


 and null values in Pyspark")
