Quantile and Decile rank of a column in pandas python is carried out using qcut() function with argument (labels=False) . qcut() function is used for dividing data into quantiles (such as deciles, quartiles, etc.). we will see example of both quantile and decile rank
Let’s see how to ·
- Get the Quantile rank of a column in pandas dataframe in python·
- Get the Decile rank of a column in pandas dataframe in python
With an example for each .First let’s create a dataframe
import pandas as pd
import numpy as np

#Create a DataFrame
df1 = {
     'Name':['George','Andrea','micheal','maggie','Ravi','Xien','Jalpa'],
   'Mathematics_score':[62,47,55,74,32,77,86]}

df1 = pd.DataFrame(df1,columns=['Name','Mathematics_score'])
print(df1)
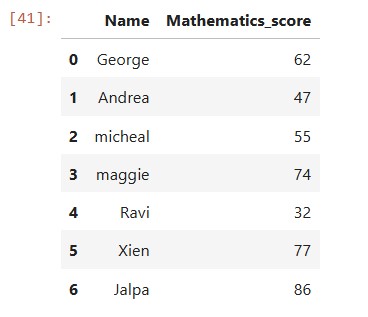
df1 will be
Quantile rank of a column in a pandas dataframe python
In this case, you’ll divide the data into 4 equal parts, assigning each row a rank from 0 to 3, where 0 represents the lowest decile and 3 represents the highest.
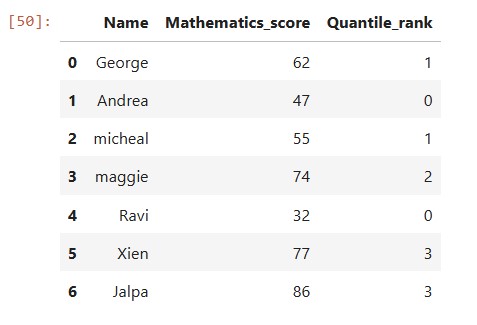
Quantile rank of the column (Mathematics_score) is computed using qcut() function and with argument (labels=False) and 4 , and stored in a new column namely “Quantile_rank” as shown below
df1['Quantile_rank']=pd.qcut(df1['Mathematics_score'],4,labels=False)
print(df1)
Explanation:
pd.qcut(df1['Mathematics_score'], 4, labels=False): Divides the data inMathematics_scorecolumn into 4 equal parts (quantiles) and assigns each row a quantile rank from 0 to 3.labels=Falsemakes sure the result is an integer representing the quantile rank instead of an interval range.
so the resultant dataframe will have quantile rank ranging from 0 to 3
Decile rank of a column in a pandas dataframe python using qcut() function:
In this case, you’ll divide the data into 10 equal parts, assigning each row a rank from 0 to 9, where 0 represents the lowest decile and 9 represents the highest rank
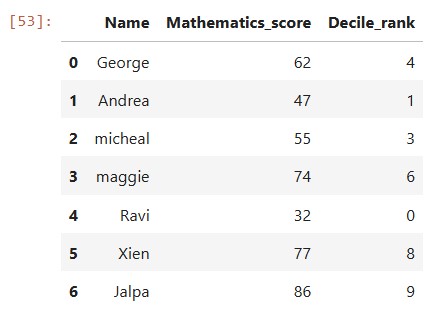
Decile rank of the column (Mathematics_score) is computed using qcut() function and with argument (labels=False) and 10 , and stored in a new column namely “Decile_rank” as shown below
df1['Decile_rank']=pd.qcut(df1['Mathematics_score'],10,labels=False)
print(df1)
Explanation:
pd.qcut(df1['Mathematics_score'], 10, labels=False): Divides the data inMathematics_scorecolumn into 10 equal parts (deciles) and assigns each row a decile rank from 0 to 9.labels=Falsemakes sure the result is an integer representing the decile rank instead of an interval range.
so the resultant dataframe will have decile rank ranging from 0 to 9
Decile rank of a column in a pandas dataframe python using rank() function:
In this case, you’ll divide the data into 10 equal parts, assigning each row a rank from 1 to 10, where 1 represents the lowest decile and 10 represents the highest rank
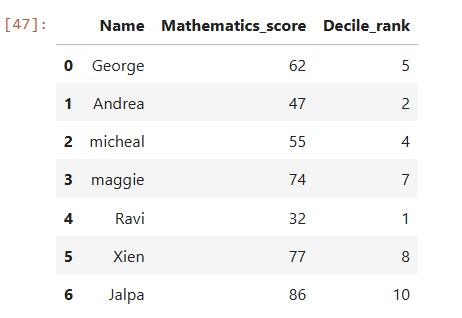
Decile rank of the column (Mathematics_score) is computed using rank() function and with argument (pct=True) and stored in a new column namely “Decile_rank” as shown below
df1['Decile_rank'] = (df1['Mathematics_score'].rank(pct=True) * 10).astype(int)
df1
Explanation:
rank(pct=True)gives a percentile rank for each value.- Multiplying by 10 gives values from 1 to 10.
astype(int)converts these to integer deciles (1 to 10).
so the resultant dataframe will have decile rank ranging from 1 to 10
