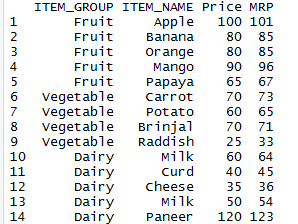
A Data frame is a list of vectors of equal length. Data frame in R is used for storing data tables.
Following are the characteristics of a data frame.
- The column names should be non-empty.
- The row names should be unique.
- The data stored in a data frame can be of numeric, factor or character type.
- Each column should contain same number of data items.
Create Data Frame in R:
Following variable student_df is a data frame containing two vectors subject and percentage
# create data frame in R.
subject=c("English","Maths","Chemistry","Physics") # vector1 named as subject
percentage =c(80,100,85,95) # vector2 named as percentage
students_df=data.frame(subject,percentage) # Vector1 and vector2 together as dataframe
When we execute the above code, it produces the following result −
subject percentage
1 English 80
2 Maths 100
3 Chemistry 85
4 Physics 95
Which is in the form of a table.
Rename the columns of Data Frame in R:
you can rename the columns of data frame in R. Just pass a vector of names to the names(df) function
names(students_df)<-c("Course","Score")
When we execute the above code, subject is renamed with Course and percentage is renamed with Score and it produces the following result −
Course Score
1 English 80
2 Maths 100
3 Chemistry 85
4 Physics 95
Accessing elements of Data frame in R:
nrow(students_df) # number of rows in data frame
ncol(students_df) # number of columns in data frame.
dim(students_df) # Dimension of data frame
students_df[1,2] # Access first row and second column of the data frame
students_df[,1] # Access all the elements of the first column
When we execute the above code, it produces the following result −
[1] 4
[1] 2
[1] 4 2
[1] 80
[1] English Maths Chemistry Physics
Levels: Chemistry English Maths Physics
Working with data frame in Detail: Get the Structure of the Data Frame
The structure of the data frame in R can be seen by using str() function
str(students_df)
The above code produces the following output.
‘data.frame’: 4 obs. of 2 variables:
$ subject : Factor w/ 4 levels “Chemistry”,”English”,..: 2 3 1 4
$ percentage: num 80 100 85 95
Summary of the data frame:
The statistical summary and nature of the data can be obtained by applying summary() function.
summary(students_df)
The above code produces the following output.
subject percentage
Chemistry:1 Min. : 80.00
English :1 1st Qu.: 83.75
Maths :1 Median : 90.00
Physics :1 Mean : 90.00
‘ 3rd Qu.: 96.25
‘ Max. :100.00
Extract Data from Data Frame in R:
We can Extract specific column from a data frame in R using column name. This can be done with the “$” Symbol. Dataframe_name$Column_name will give you the value of the specific column
it will be explained with employee table
# Create the data frame.
emp.data <- data.frame(emp_id = c (1:5),
emp_name = c("john","marsh","mitchell","lara","peter"),
salary = c(6213,1515,4113,3729,2843),
joining_date = as.Date(c("2012-12-01","2014-07-23","2012-11-15","2015-05-11","2016-03-27")),
stringsAsFactors=FALSE )
Table named emp.data is created with columns emp_id, emp_name, salary and joining_date. The above code produces following data frame
emp_id emp_name salary joining_date
1 1 john 6213 2012-12-01
2 2 marsh 1515 2014-07-23
3 3 mitchell 4113 2012-11-15
4 4 lara 3729 2015-05-11
5 5 peter 2843 2016-03-27
As explained earlier Dataframe_name$Column_name will give you the value of the specific column
emp.data$emp_name
will produce the following output, that is list of employee names
[1] “john” “marsh” “mitchell” “lara” “peter”
Following code extracts the employee name and salary from “emp.data” data frame and creates a separate data frame named “result”
# get the column elements of data frame in R and create a new data frame

result <- data.frame(emp.data$emp_name,emp.data$salary)
print(result)
Above code will produce the following output
emp.data.emp_name emp.data.salary
1 john 6213
2 marsh 1515
3 mitchell 4113
4 lara 3729
5 peter 2843
Now lets Extract the first two rows and then all columns using the syntax dataframe_name[Row,Column] . If the column value left empty it will select all the Column.
# extract first two rows with all the columns

result <- emp.data[1:2,]
print(result)
Above code will produce the following output
emp_id emp_name salary joining_date
1 john 6213 2012-12-01
2 marsh 1515 2014-07-23
Now lets extract first 3 columns with all the rows so we have to use the same syntax dataframe.name[Row,Column] and row value should be left empty
# extract first 3 columns with all the rows

result <- emp.data[,1:3]
print(result)
Above code will produce the following output. Which has all the rows and first three Columns
emp_id emp_name salary
1 1 john 6213
2 2 marsh 1515
3 3 mitchell 4113
4 4 lara 3729
5 5 peter 2843
Now lets Extract 3rd and 5th row with 2nd and 4th column
# Extract 3rd and 5th row with 2nd and 4th column of data frame in R.
result <- emp.data[c(3,5),c(2,4)]
print(result)
Above code will produce the following output
emp_name joining_date
3 mitchell 2012-11-15
5 peter 2016-03-27
Row bind and column bind operation on data frame in R :
A data frame in R can be expanded by adding columns and rows. Following example is Just to add the column vector using a new column name. A vector is passed to data frame to add the column in data frame with “$” symbol in below example.
# Add the "dept" coulmn.

emp.data$dept <- c("IT","Operations","IT","HR","Finance")
v <- emp.data
print(v)
Above code will produce the following output
emp_id emp_name salary joining_date dept
1 1 john 6213 2012-12-01 IT
2 2 marsh 1515 2014-07-23 Operations
3 3 mitchell 4113 2012-11-15 IT
4 4 lara 3729 2015-05-11 HR
5 5 peter 2843 2016-03-27 Finance
Alternatively we can also use Row bind rbind() function and column bind cbind() function to add the Row and Column to the data frame. We can join multiple vectors to create a data frame using the cbind() function. Also we can merge two data frames using rbind() function.
# create a vector called designation

designation <- c ("Entry level","Manager","Technical specialist","Entry level","Senior Level")
emp.table<-cbind(emp.data,designation)
print(emp.table)
The above code uses Column bind function cbind() which binds the vector named designation with the data frame emp.data
Which produces the following result
emp_id emp_name salary joining_date dept designation
1 1 john 6213 2012-12-01 IT Entry level
2 2 marsh 1515 2014-07-23 Operations Manager
3 3 mitchell 4113 2012-11-15 IT Technical specialist
4 4 lara 3729 2015-05-11 HR Entry level
5 5 peter 2843 2016-03-27 Finance Senior Level
Similarly Row bind function rbind() binds two data frame into single data frame. Prerequisite is both the data frame should have same number of columns and should have same column names
lets look at the example for Row bind function rbind().
# Create the second data frame.
 emp.table.new <- data.frame(
 emp_id = c (6:8),
 emp_name = c("lila","raj","tera"),
 salary = c(2413,5415,6413),
 joining_date = as.Date(c("2014-03-01","2015-07-23","2016-11-15")),
 dept=c("IT","Finance","Operartions"),
 designation = c("Manager","Entry level","Senior Level"),
 stringsAsFactors=FALSE
)

# Binds the two data frames.
emp.table.final<- rbind(emp.table,emp.table.new)
print(emp.table.final)
The above code uses row bind function rbind() which binds the data frame named emp.table.new with the data frame emp.table which produces an another data frame emp.table.final
Which produces the following result
emp_id emp_name salary joining_date dept designation
1 1 john 6213 2012-12-01 IT Entry level
2 2 marsh 1515 2014-07-23 Operations Manager
3 3 mitchell 4113 2012-11-15 IT Technical specialist
4 4 lara 3729 2015-05-11 HR Entry level
5 5 peter 2843 2016-03-27 Finance Senior Level
6 6 lila 2413 2014-03-01 IT Manager
7 7 raj 5415 2015-07-23 Finance Entry level
8 8 tera 6413 2016-11-15 Operartions Senior Level
